Kubernetes Health checks, what are they for and, why are they useful? And what is the difference between a liveness probe, a readiness probe, and a startup probe?
These are probably very abstract concepts to you. So before I go straight into explaining these, I think it is better that I share a story from my time as a Java Developer when Kubernetes didn’t exist yet.
Let’s go back in time. It was in 2009, a long long time ago, at the time of the iPhone 3. It was the year when the first Bitcoin transaction was made.
It was then that I finally got my big chance, working for a very cool fashion brand in the heart of London. I was a Java developer and part of a large team implementing their brand-new redesigned website. Let’s call them FashionRus.com.
FashionRus Original Architecture
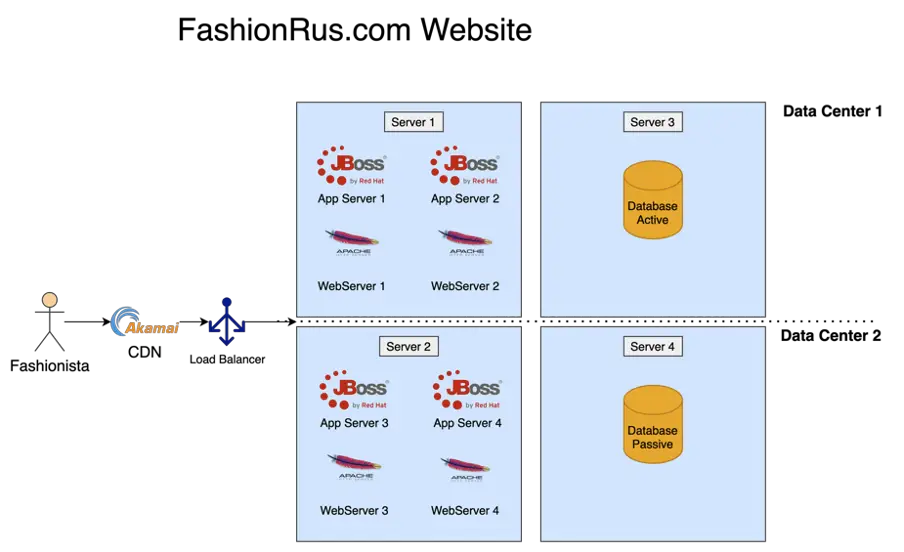
We were using JBOSS as our application server and coding in the best programming language at the time, Java! We had 4 application server instances, 2 in each data center, 4 apache web servers, 2 in each data center, 2 database servers, 1 in each data center, and a load balancer serving traffic equally across all the instances. We were also using Akamai for our CDN.
After many months of hard work, we finally managed to complete the development of Fashionrus.com. So the go-live day was scheduled.
FashionRus.com Go-Live Disaster
The go-live day came and we were ready. We switched the DNS to the new site and it worked! The new website started getting loads of web traffic. And running smoothly.
But things started going wrong very quickly, just as we were celebrating the go-live.
So, we went back to the office and logged in to each server. Each server seemed to be working fine for a few hours and then all of a sudden started throwing all kinds of exceptions and then grind to a halt. This was a very strange problem because it cascaded quickly to all the servers.
A Memory Leak or something more complicated?
We suspected it was a memory leak, but even if it was, we had no clue where the source of the memory leak was. It was going to take time to resolve the issue.
So in agreement with the operations team, we agreed to monitor the logs and as soon as the error showed up again, we would restart all the servers. We created a script to do the automatic restart. This bought us some time.
The restart helped to a certain extent. However the load balancer was still sending requests to the server restarting, so some users would still experience a broken page on the website. Not a great fashion experience.
Okay so you might be asking, did we ever find the source of the error?
Yes, we did. It turned out to be a bug in JBOSS’s session replication. By switching off session replication we were able to prevent the website from crashing regularly. However, from time to time we would still get an outage because of peaks of traffic.
Re-architecting FashionRus.com using Google Kubernetes Engine
But the point of telling you this story is just to show you how everything could have been different if we had Kubernetes and health checks.
So I am going to go back in time and implement Kubernetes health checks 🙂
First, let’s change the architecture:
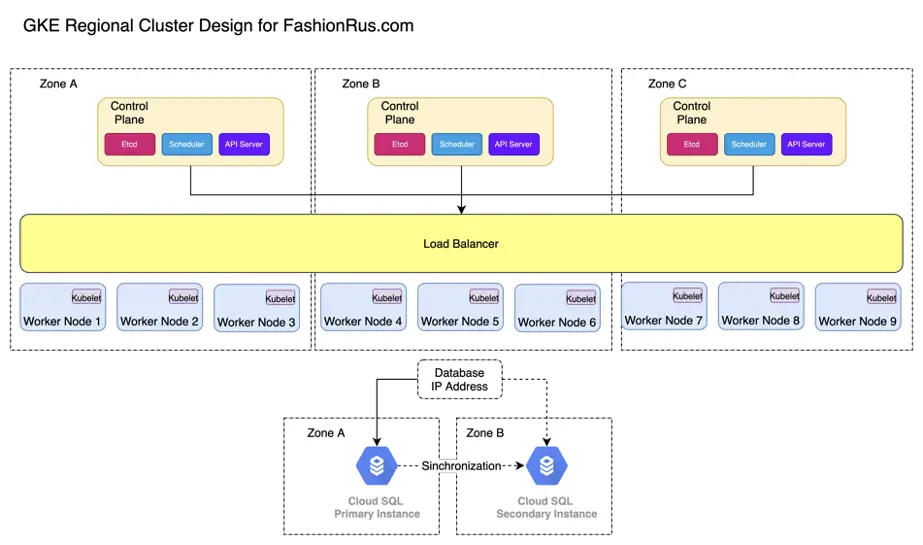
Now instead of having 4 physical servers in two data centers, we have a GKE Regional cluster, with 3 control planes and 9 Worker nodes. 1 control plane with 3 worker nodes in each zone. A zone in GCP is a separate data center within a GCP region. Each control plane and each worker node are separate VMs.
And we have exposed our website using an ingress that is connected to a GKE load balancer.
The FashionRus.com website has nine pod replicas, with JBoss running in each worker node. We are using a managed MySQL database, so no need to worry about it, too much.
To ensure that our JBOSS pods are restarted every time, the pods stop responding to requests, we need to define a liveness probe for the JBOSS pod.
What is a liveness probe in Kubernetes?
A liveness probe is a health check provided by Kubernetes to check that each container inside a pod is healthy. The liveness probe gets called periodically by the kubelet and if a liveness probe comes back with a status of ERROR, then the kubelet will automatically kill the container and restart it based on the pod’s pre-defined restart policy.
There are three types of Liveness probe:
- TCP
- HTTP
- Command
TCP

The TCP Liveness probe regularly attempts to open a TCP/IP connection on a given port. This could be useful to do simple liveness checks for containers that rely on TCP such as FTP.
livenessProbe:tcpSocket
:port: 21 # FTP
failureThreshold: 5
initialDelaySeconds: 5
periodSeconds: 10
In this example, we can see an example of a TCP liveness probe that checks every 10 seconds, port 21, the port normally used by FTP.
This is to see if it can successfully establish a TCP/IP connection. In this example, we didn’t specify the successThreshold, but we know it will default to 1. This means every time a valid TCP connection on port 21 is establish by the health check, then the container is considered to be alive and well.
On the other hand we have increased the failureThreshold to 5 so that the odd failure in connection doesn’t immediately trigger a restart of a pod.
HTTP
The HTTP liveness probe is a simple probe that makes an HTTP GET request to an HTTP server running inside the container on a given path and port. If it returns been 200 OK or less than 400, it means the container is alive and well. Any other HTTP return code means that all is not well with the container, so after a number of failed attempts, the Kubelet will attempt to restart the container.
livenessProbe:
  httpGet:
    path: /alive
    port: 80
  failureThreshold: 5
  initialDelaySeconds: 5
  periodSeconds: 10
Command
Sometimes it is not straightforward to know if a container is ready to receive requests. For those special cases, Kubernetes has the Command liveness probe.
The Command liveness probe gives us complete control on how to do the health check. We can use any command available within the container. For instance, we can check the contents of a file. Or you can even write your own script, which is included in the container and executed by the Command probe.
livenessProbe:
      exec:
        command:
        - cat
        - /tmp/alive
      failureThreshold: 5
      initialDelaySeconds: 5
      periodSeconds: 5
Setting Up a Liveness Probe
Now, enough theory. Let’s try to create a liveness probe for the FashionRus website, which we have already migrated to Kubernetes.
For the JBOSS container, since it accepts requests on port 8080, we need to set up an HTTP liveness probe that targets port 8080:
livenessProbe:
  httpGet:
    path: /
    port: 8080
  successThreshold: 1
  failureThreshold: 5
  initialDelaySeconds: 50
  periodSeconds: 10
Note, that there are some important parameters we are passing:
- successThreshold — we set the successThreshold to 1, but because this parameter defaults to 1, we could ommit it. This means if one HTTP Get Requests returns 200, the Get request is successful.
- failureThreshold — we set the failure threshold high enough that even if the liveness probe fails up to 5 times(the default is 3), it will not cause the JBOSS container to be immediately restarted. This parameter will depend on the robustness of the application and the likelihood of it failing from time to time. If we set too low a threshold, then we could have quite a few restarts of the container happening, causing even more problems.
- timeoutSeconds — this is an important parameter. We need to have an idea of the typical response times of our JBOSS container for this page. If we set the timeout too low and the typical response times exceed the value set in timeoutSeconds then we are going to have serious problems as the container will crash continuously.
- initialDelaySeconds- Java is slow, and it takes at least 30 seconds for the JBOSS application server to be immediately available. For that reason, we set an initialDelaySeconds of 30 to ensure that the kubelet doesn’t call the liveness probe too early before the container is ready to receive traffic.
Now, thanks to the liveness probe the fashionrus.com website is going to stay alive even if our pods crash, as the kubelet will restart them automatically. Isn’t that great?
Setting up a Readiness Probe
We just have a small problem. It takes at least 30 seconds for a new pod to start, and while the pod is starting, any traffic directed to that pod will fail. Not a great user experience!
We can fix this by setting up a Readiness check! A Readiness check is very similar to a Liveness check, except that the Kubelet doesn’t restart the pod if the Readiness check fails.
Any time that the Readiness check fails over a failureThreshold, the pod is removed from the list of pods that receive requests from a service load balancer.
When the Readiness check succeeds over a successThreshold, the pod is added to the list of pods that receive requests from a service load balancer.
So this how our readiness probe looks like:
readinessProbe:
  httpGet:
    path: /
    port: 8080
  successThreshold: 1
  failureThreshold: 3
  initialDelaySeconds: 30
  periodSeconds: 10
With this configuration, our readiness probe waits initially for 30 seconds to allow the container to start, and then it sends every 10 seconds an HTTP request to port 8080, until it is able to get an HTTP response with a status greater or equal to 200 and less than 400. The probe waits up to 3 seconds to get a response for each health check attempt.
Setting up a Startup Probe
One of the drawbacks of readiness and liveness probes is that they are independent of each other. For instance a readiness probe might be patiently waiting for a container to be ready but the liveness probe may kill it, before it becomes ready.
For slow starting containers, like Java processes, this can be a problem.
Wouldn’t it be nice if there was a probe that could disable temporarily the readiness and liveness probe until the container was ready?
That’s why the startup probes were introduced recently. To wait for a container to be initialized and ready for receiving new requests.
livenessProbe:
  httpGet:
    path: /
    port: 8080
  successThreshold: 1
  failureThreshold: 3
  periodSeconds: 10
readinessProbe:
  httpGet:
    path: /
    port: 8080
  successThreshold: 1
  failureThreshold: 3
  periodSeconds: 10
startupProbe:
  httpGet:
    path: /
    port: 8080
  failureThreshold: 30
  periodSeconds: 10
So let’s add a startup probe to our kubernetes configuration.
The startup probe looks very similar to a readiness probe or a liveness probe.
The main goal of the startup probe is to give enough time for slow-running containers to start by disabling all readiness and liveness probes until the startup probe succeeds.
In this configuration, we created a startupProbe to check every ten seconds if the container is started successfully. We set a failure threshold of 30, which means that if the container doesn’t start within 300 seconds, the Pod will be marked as failed.
If the probe succeeds at least once, then the readiness and liveness probe will be enabled and everything proceeds as normal!
Conclusion
And that’s it! We have turned our FashionRus.com website around by using Kubernetes Health Checks!